Loading page…
Pitch
Description
Comments
Visualize GitHub contributions on an interactive world globe.
Project details
This project enables users to display a dynamic badge depicting their GitHub contributions on a world map. By utilizing the Cobe WebGL library, the badge offers a rotating globe view, showcasing contribution statistics per country. Clicking the badge reveals an interactive globe, enhancing the user experience and providing insights into global contributions.
This project offers a dynamic GitHub contribution analytics badge that visually represents the geographical distribution of contributions made by the owner's repositories. The badge is updated daily and features an interactive Cobe globe hosted on GitHub Pages that can be accessed by simply clicking the badge.
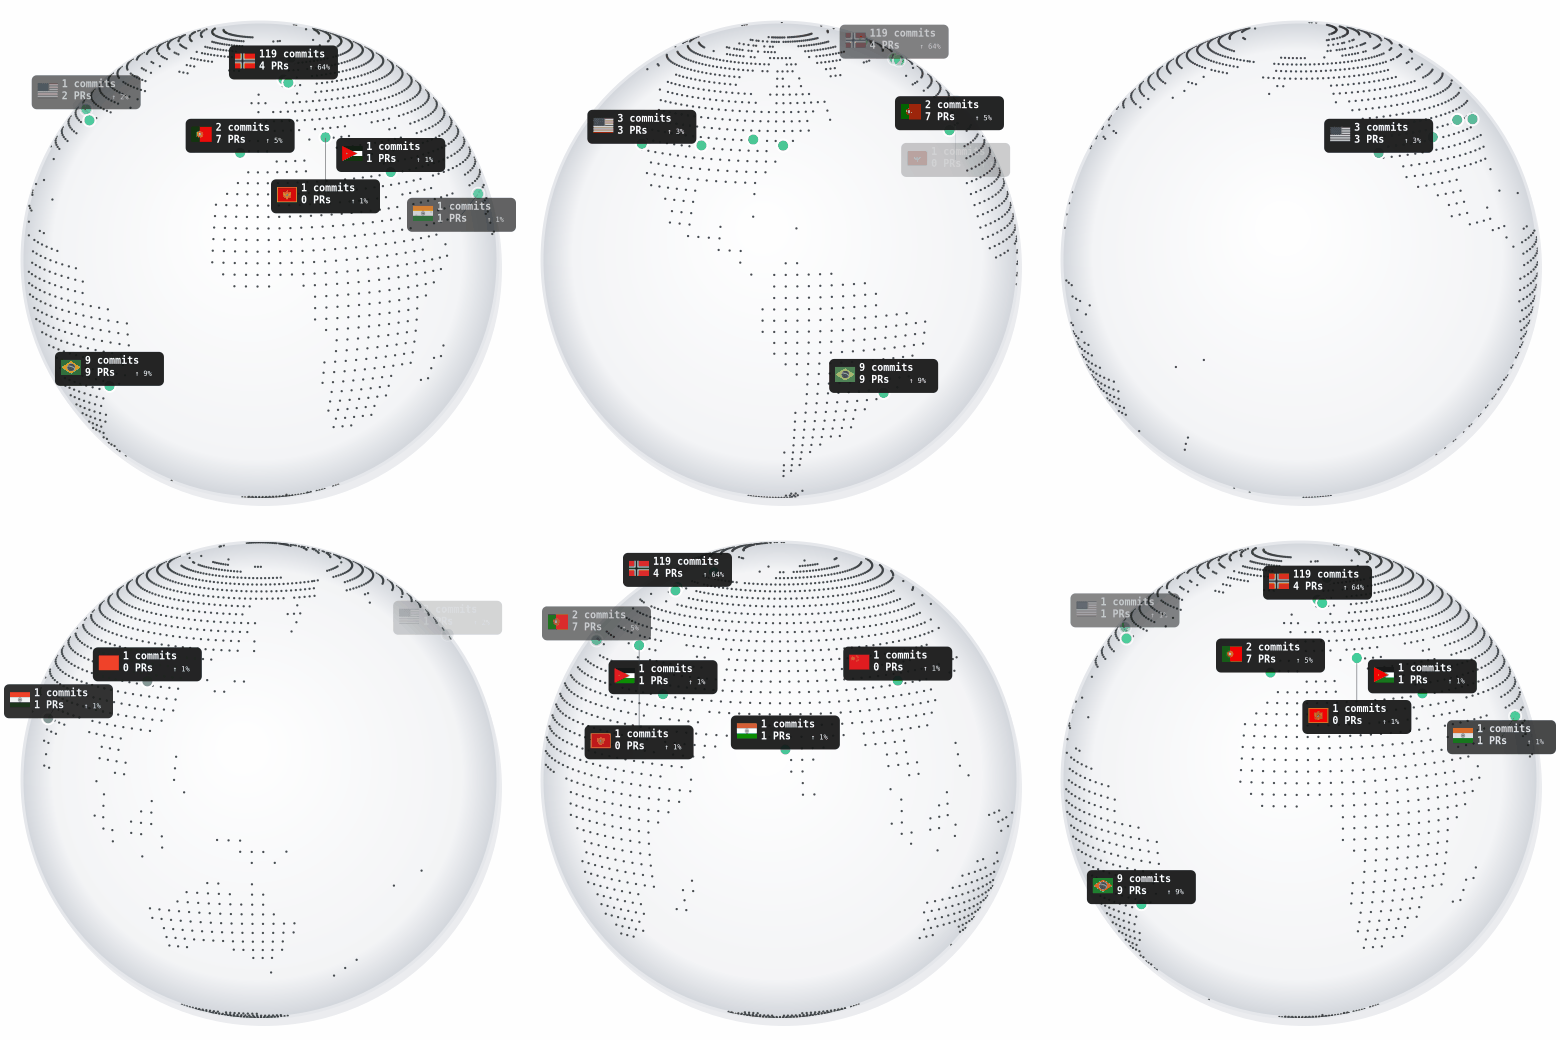
Co-authored-by: trailer.To personalize the badge for your GitHub profile, forking the repository is required. Once forked, the workflow will automate badge generation linked to your username. The badge can be embedded in your README as follows:
[](https://<YOUR_USERNAME>.github.io/github-contrib-globe-badge/)
The date range for contributions can be adjusted within the generator script. Further customization of the interactive globe's appearance can be done through the globe options and styling in the index.html file.
To get started with local testing, install the necessary packages and run the generator with your GitHub username:
npm install
GITHUB_ACTOR=<YOUR_USERNAME> node badge/generate-badge.js
The generator writes both badge.gif and data.json, which are used to reflect contribution data.
This project leverages the powerful Cobe WebGL library for globe rendering, along with flag images sourced from flag-icons, providing an engaging user experience while honoring each contributor's effort on GitHub.
Comments
0Start the conversation
Share the first comment.